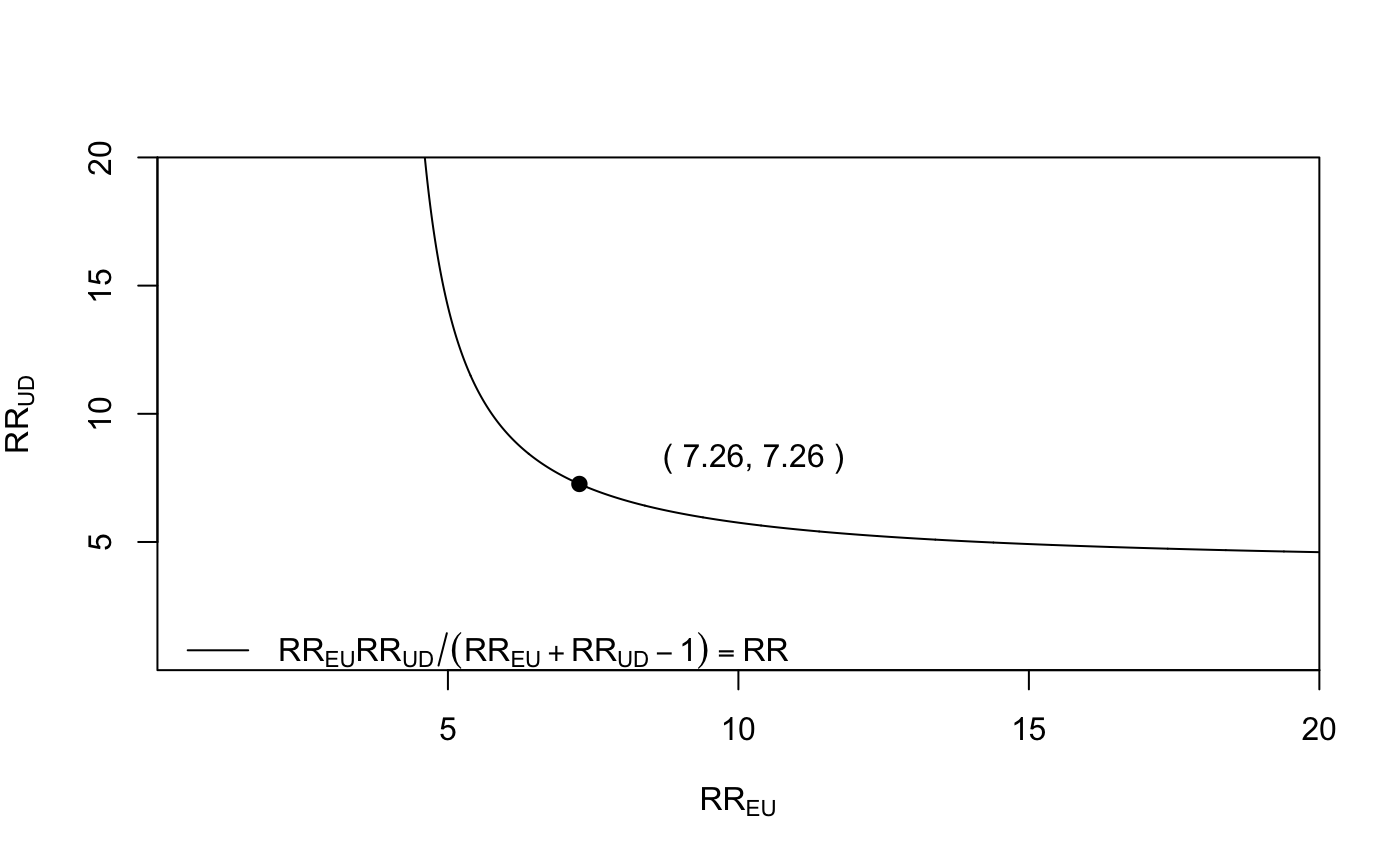
Plot bias factor as function of confounding relative risks
bias_plot.RdPlots the bias factor required to explain away a provided relative risk.
bias_plot(RR, xmax)
Arguments
| RR | The relative risk |
|---|---|
| xmax | Upper limit of x-axis. |
Examples
# recreate the plot in VanderWeele and Ding (2017)
bias_plot(RR=3.9, xmax=20)